Summary
Real world comparison Niton XRF Vs Hitachi XRF Vs Lab Assay of car catalytic coverters assaying Rhodium Palladium and Platinum
Real World Comparison of Handheld XRF Analyzers
For assaying car catalytic converters’ PGM content (Niton XL3t GOLDD+ & Hitachi X-MET8000)
Abstract
Precious metals content in spent auto catalytic converter monoliths (honeycomb), are usually in the range of 200 – 3000 PPM per element (Pd, Pt, Rh). Considering the economic aspects of the precious metals content, the accuracy of the assay is very important. For example, if the content of Rh is 200 ppm and the assay would be 300 ppm (only 100 ppm difference), it can cause a 33% money loss.
Collecting, recycling and refining of Auto Catalytic converters, is a big business. As metal prices increase, competition goes up and margins go down. Fast and accurate data is essential for making the right decisions.
Handheld X-Ray fluorescent analyzers enable recyclers to quickly identify Pt, Pd and Rd in catalytic converters. They are a non-destructive analytical technique used to determine both qualitative and quantitative elemental material composition. Handheld devices are portable and easy to use compared to the benchtop analyzers.
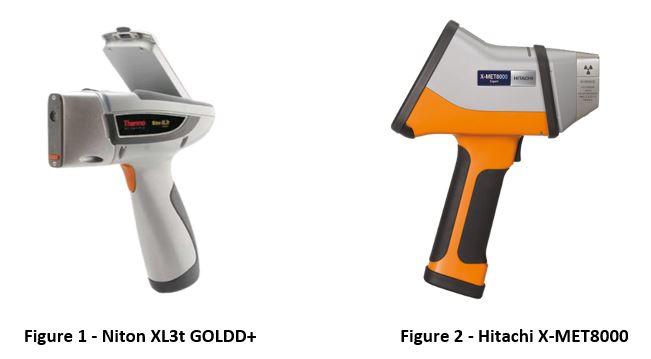
The use of XRF analyzers to assay the monolith PGM content is simple and fast. This comparison set out to check the accuracy of two of the leading handheld XRF analyzers, the Thermo Scientific Niton XL3t GOLDD+ and the Hitachi X-MET8000, in assaying PGM content Auto Catalyst monolith.
Sampling and Assaying
All samples of the ceramic monolith were milled and dried into powder with particle size of 150 µm (max).
Number of samples analyzed: 21 (Pd), 18 (Pt), 17 (Rh)
We use “sample cups” with polypropylene 6 µm.
Time duration of the assay was 120 sec.
Results
The comparison results of this work are presented in the following tables and graphs for: Palladium (A), Platinum (B) and Rhodium (C):
Table # 1
Summary of the comparison results between the Niton XL3t GOLDD+ and the Hitachi X-MET8000 as compared to the lab results. Presented in parameters of average deviation in percentage (Δ%), and correlation factor (R²).
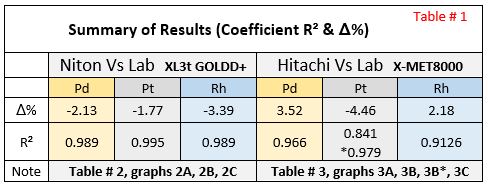
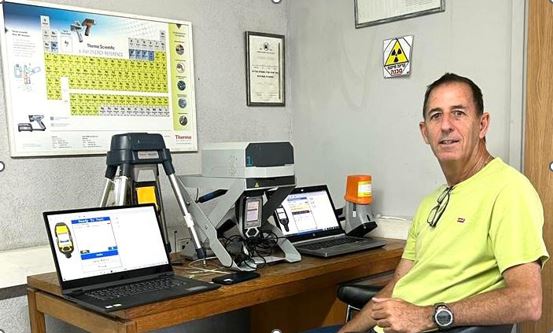
Figure 3 – Ami Gur, CEO, at the A.G.Metals XRF assaying station.
Niton XL3t GOLDD+ (center), Hitachi X-MET8000 (right)
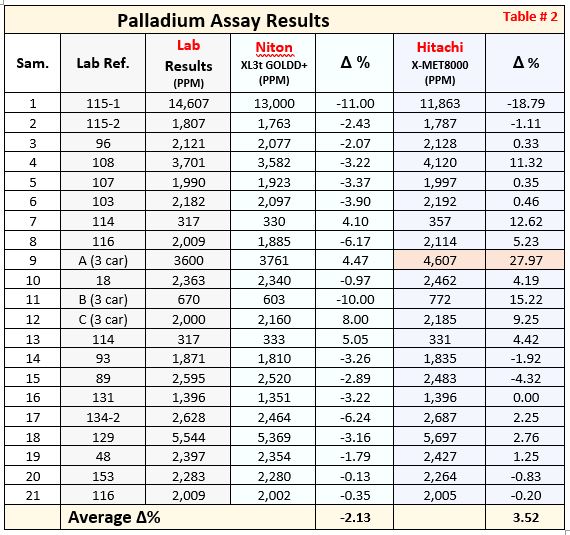
Table # 2
Palladium assay results (Niton VS Hitachi VS Lab)
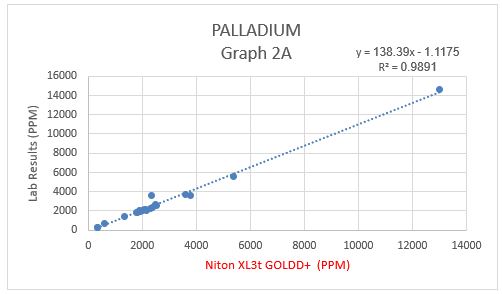
Graph # 2A
Correlation factor R² between Niton and Lab for Palladium
Graph # 3A
Correlation factor R² between Hitachi and Lab for Palladium
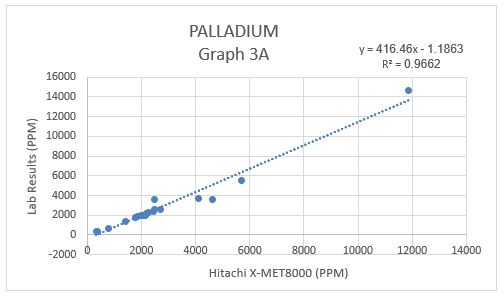
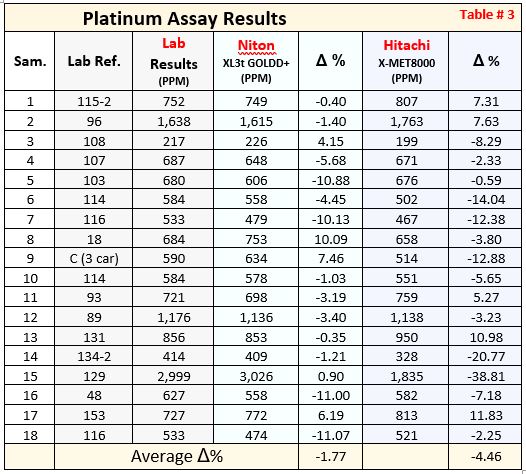
Table # 3
Platinum assay results (Niton VS Hitachi VS Lab)
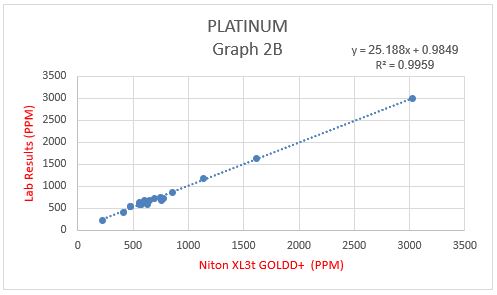
Graph # 2B
Correlation factor R² between Niton and Lab for Platinum
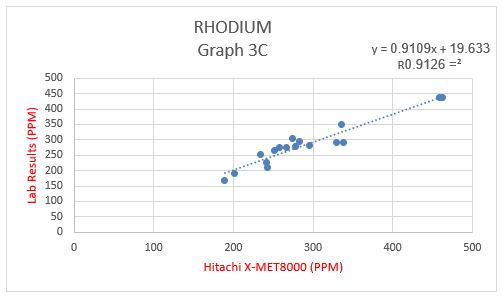
Graphs # 3B, 3B*
Correlation factor R² between Hitachi and Lab for Platinum (3B & 3B*)
Note that 3B shows lower R² due to single sample out of optimal range for Hitachi (more in discussion).
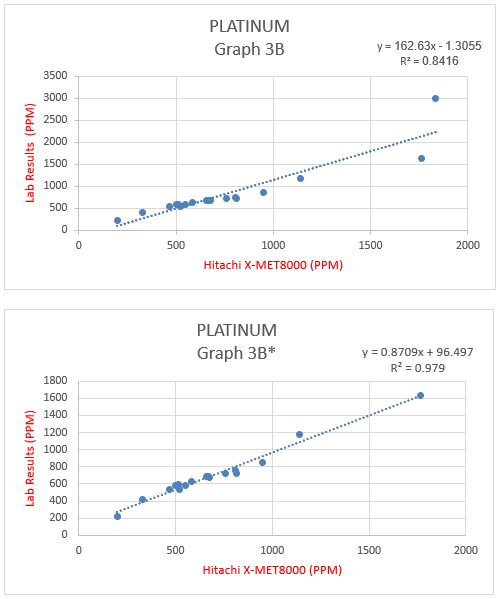
Table # 4
Rhodium assay results (Niton VS Hitachi VS Lab)
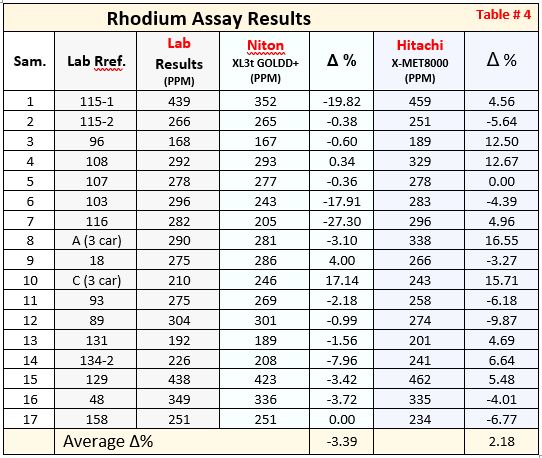
Graph # 2C
Correlation factor R² between Niton and Lab for Rhodium
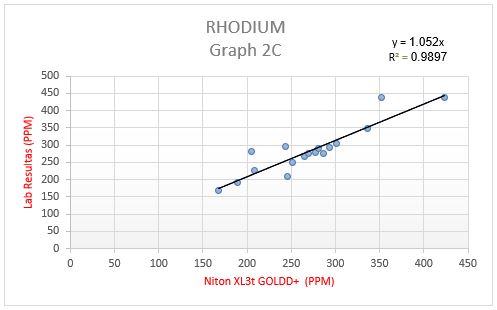
Graph # 3C
Correlation factor R² between Hitachi and Lab for Rhodium
Discussion & Summary –
Both the Niton XL3t GOLDD+ and the Hitachi X-MET8000 present reliable results in assaying the PGM content of the tested monolith. These findings further support their use in testing metal content and composition by professionals in the industry.
We note that sampling and assaying must be done properly and according to the instructions for optimal results.
The Hitachi X-MET8000 is calibrated to a limited range of (Pt 697-2493 PPM, Pd 233-1812 PPM, Rh 51-344 PPM). When the sample PGM content is out of the calibration range, the accuracy of the results drops.
A good example of this are graphs 3B and graph 3B* – the factor R² changes from 0.8416 to 0.979 when sample out of calibration range is removed from the data.
It is also possible to observe in graph 3A, that Pd results are more accurate in the calibrated range.
In some of the auto catalytic converters, PGM content can be over 10,000 PPM, I assume that new calibration will apply for the Hitachi to meet market needs.
CataBase Project
A.G. Metals LTD
Ami Gur B.Sc. Material Engineering
